
Direction.
Directions: Answer the questions on the basis of following information. The line graph given below shows the revenue (in million $) generated by five restaurants in its Take away and Dine In facility. The table below gives the break-up of the revenue generated through Take away and Dine In facility of five restaurants in Indian and Chinese foods.Ratio of Revenue generated by these five restaurants in Indian and Chinese food is as given below
Performance of a restaurant A is better than restaurant B either in Take away or in Dine In only if sales of restaurant A is better than that of restaurant B in both Indian as well as Chinese food.
For which restaurant the revenue earned from Indian food is maximum
Foodie
Dhaba
Pizza hut
Sarson
Correct Answer :
C. Pizza hut
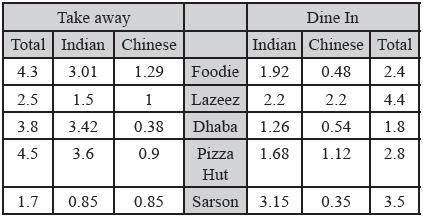
Revenue earned is as follows-
(a) Foodie :- 3.01 + 1.92 = 4.93
(b) Dhaba:- 3.42 + 1.26 = 4.68
(c) Pizza hut :- 3.6 + 1.68 = 5.28
(d) Sarson:- 0.85 + 3.15 = 4.0
So for Pizza hut it is the maximum
Related Questions
If the forecasted demand is met by having uniform production during the weeks at an average level, then the number of weeks during which demand will not be met is :
2
3
4
None of these
In 2004, the prices of plywood, sawn timber and logs went up by 5%, 1% and 10% respectively and the total sales were made up of 40% plywood, 30% sawn timber and 30% logs. The average realization per cubic metre in 2004 was closest to
Rs. 15,500
Rs. 16,135.5
Rs. 14,500
Rs. 18,500
In which values score, there exists maximum difference between average female profiles and personal profile?
Theoretical
Religious
Economic
Political
Which product had the largest percentage increase in price per cubic metre over the 7 year period?
Sawn timber
Logs
Plywood
Cannot be determined
In which month did the company earn maximum profits?
5
4
3
2
Which of the salts has greater change in solubility in kg / litre of water between 15°C and 25°C?
Potassium Chlorate
Potassium Nitrate
Sodium Chlorate
Sodium Nitrate
Find the total number of automobiles exported in the year 1999 :
2,27,600
2,07,600
2,17,600
2,20,000
Suppose that each widget sells for Rs. 150. What is the profit earned by ABC Ltd. in July? (Profit is defined as the excess of sales revenue over total cost.)
2400
1600
400
0
In which month is the percentage increase in sales two months before, the highest?
March
September
July
May
How many of the restaurant definitely performed better than Dhaba in both Take away and Dine In?
0
1
2
3
In 2003, the total sales of the company measured in cubic metres was made up of 40% plywood, 30% sawn timber and 30% logs. The average realization per cubic metre in 2003 was closest to
Rs. 16,500
Rs. 13,500
Rs. 15,425
Rs. 18,000
The highest percentage of growth in sales, relative to the previous year, occurred in
1995-96
1996-97
1997-98
1998-99
What is the total expenditure during the period under review (7 months) in 1997?
21,07,000
21,96,000
21,54,000
21,24,000
In which month was the greatest percentage increase in market value for any share recorded?
February
March
April
May
If the ratio of export prices of a cars, scooter and motorbike was 2 : 1 : 1.5 in 1998, what was the proportion of their export earnings?
4 : 2 : 3
6 : 1 : 21
45 : 24 : 31.5
Cannot be determined
The number of educated and illiterate members (not highly educated) who joined the club in 2013 as a percentage of total number of men who joined the club in the same year could not be more than
11.43
15.65
9.63
17.34
Score of how many of the groups can be determined uniquely?
1
2
3
4
What is the profit in the year 1998?
Rs. 110
Rs. 143
Rs. 95
cannot be determined
Which month has the highest profit per employee?
September
July
January
March
Defining profitability as the ratio of net profit to sales, IVP Ltd. recorded the highest profitability in
1998-99
1997-98
1994-95
1996-97
What was the maximum value of spending on CSR activities in the period 2004 2009?
Rs. 0.5 Crore
Rs. 1.0 Crore
Rs. 2.0 Crore
Rs. 3.0 Crore
If the train stops at each city for 30% more time that what it is at the moment, then at what time will it reach the city H after departing from city A as per schedule?
Data insufficient
17 : 03
16 : 41
16 : 58
For which restaurant the revenue earned from Indian food is maximum
Foodie
Dhaba
Pizza hut
Sarson
Which month has been the least expensive during 1999?
June
April
May
July
Find the ratio of cars, scooters and motorbikes exported in 1996 :
25 : 16 : 19
16 : 25 : 19
19 : 16 : 25
6 : 5 : 1
If the amount invested by the two companies in 2005 was equal, what was the ratio of the total income of the company A to that of B in 2005?
31 : 33
33 : 31
34 : 31
14 : 11
Which year registered the maximum sales turnover?
1994
1995
1992
1993
In which year was the increase in spending on CSR, vis-a-vis the previous year, the maximum?
2006
2007
2008
2009
The expenditure in April 1999 was . . . . . . . . higher than that of corresponding period in 1998.
1.5%
2%
2.5%
0.94%
The simple annual growth rate in sales was the highest between the years?
1990 91
1991 92
1992 93
1990 92