
Direction.
Directions: Answer the questions on the basis of following information. The line graph given below shows the revenue (in million $) generated by five restaurants in its Take away and Dine In facility. The table below gives the break-up of the revenue generated through Take away and Dine In facility of five restaurants in Indian and Chinese foods.Ratio of Revenue generated by these five restaurants in Indian and Chinese food is as given below
Performance of a restaurant A is better than restaurant B either in Take away or in Dine In only if sales of restaurant A is better than that of restaurant B in both Indian as well as Chinese food.
How many restaurants performed better than sarson but not better than Foodie either in Take away or Dine in section?
0
1
2
3
Correct Answer :
B. 1
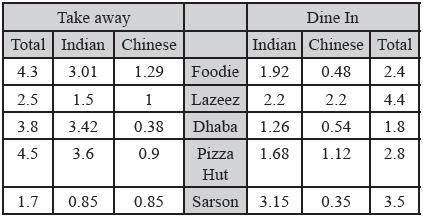
In indian Take away Lazeez satisfy the condition In Chinese Take away Lazeez, and Pizza hut satisfy the condition
So in Take away section performance of Lazeez is better than sarson but not better than Foodie
In indian Dine In, none of the restaurants satisfy the condition
So in Dine In section none of the restaurants satisfy the condition
So in total only one restaurants satisfy the condition.
Related Questions
If the profit earned in 2006 by Compnay B was 8,12,500, what was the total income of the company in that year?
12,50,000
20,62,500
16,50,000
None of these
In which year was the total number of girls enrolled in all the three schools together second highest?
2005
2006
2007
2008
In which value score, there exists convergence between personal profile and average female profile?
Theoretical
Social
Aesthetic
None of the above
The number of students keeps on increasing by 50 every years. In 1998, there were 250 students. For which of the following years is the performance best in the school?
1998
2000
1999
Cannot be determined
In which year women and men ratio is greatest?
2011
2012
2013
None of these
Total production in July is 40 units. What is the approximate average unit cost for July?
3600
90
140
115
What is the gross profit in 1993?
Rs. 27
Rs. 30
Rs. 35
None of these
In which year is sales per rupee of equity the highest?
1990
1991
1992
1994
Assume that the unit price is Rs. 150 and profit is defined as the excess of sales revenue over total costs. What is the monthly production level of ABC Ltd. at which the profit is highest?
30
50
60
40
If the total amount invested by the two companies in 2009 was ` 27 lakh while the amount invested by company B was 50% of the amount invested by Company A, what was the total profit earned by the two companies together?
21.15 lakh
20.70 lakh
18.70 lakh
20.15 lakh
If 1 mole of Potassium Chloride weighs 0.07456 kg, approximately. How many moles of Potassium Chloride can be dissolved in 100 litres of water at 36°C?
700
650
480
540
For which restaurant difference is maximum in revenue earned through Chinese food in Take-away and Dine-in section?
Foodie
Dhaba
Lazeez
Sarson
With profitability as defined in question 137, it can be concluded that
Profitability is non-decreasing during the five years from 1994-95 to 1998-99.
Profitability is non-increasing during the five years from 1994-95 to 1998-99.
Profitability remained constant during the five years from 1994-95 to 1998-99.
None of the above
In the given personal profile, which is the value with the lowest score?
Theoretical
Religious
Social
Aesthetic
Which month has been the least expensive during 1999?
June
April
May
July
In which year is the sales per rupee of expenditure the lowest?
1990
1991
1992
1993
What is the ratio of the total number of males to the total number of females passed out from all the colleges together?
19:23
18:25
23:19
25:18
In which value score, there exists a no difference state between the personal profile and average male profile?
Economic
Social
Aesthetic
None of the above.
In which month did the company earn maximum profits?
5
4
3
2
The per cent profit earned by the company in the year 2009 was what percent of the per cent profit earned by the company in the year 2005?
200
240
260
255
If A has achieved the highest score then what is the score achieved by C
330
335
325
Cant determine
The simple annual growth rate in sales was the highest between the years?
1990 91
1991 92
1992 93
1990 92
If the train stops at each city for 30% more time that what it is at the moment, then at what time will it reach the city H after departing from city A as per schedule?
Data insufficient
17 : 03
16 : 41
16 : 58
The growth rate is very marginal during the month of :
August
October
November
December
The performance for which of the following houses is the best?
Pearl
Ruby
Topaz
Sapphire
The price volatility of the commodity with the highest PV during the February-July period is approximately equal to:
3%
40%
20%
12%
Approximately, how many kg of Potassium Nitrate can be dissolved in 10 litres of water at 30°C?
0.04
0.4
4
0.35
The rate of growth during the third month was the lowest for
Geeta
Seeta
Ram
Shyam
What was the difference between the average sales index and the average cost index?
7.3
7.7
7.5
7.9
What is the profit in the year 1998?
Rs. 110
Rs. 143
Rs. 95
cannot be determined