
Direction.
Directions: Study the following graph, showing the sales forecast for the next ten weeks, to answer these questions.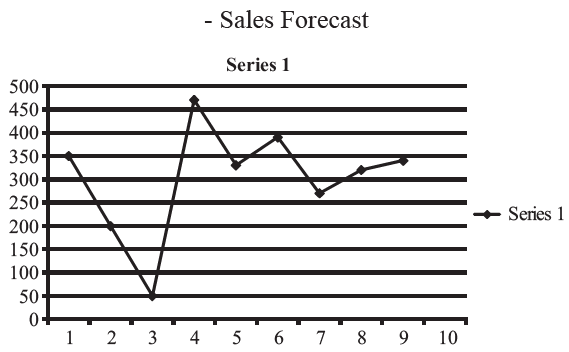
If the forecasted demand is met by having uniform production during the weeks at an average level, then the number of weeks during which demand will not be met is :
2
3
4
None of these
Correct Answer :
D. None of these
we can find out, average sales of forecast is 322. From the graph we came to know that there are four weeks during which demand will not be met.
Related Questions
If the trend observed between 1999 and 2000 continues in the next year, what will be number of students passing in the examination in 2001?
245
237
263
300
During the period 1998-2000, how many quarters exceeded the profit of Rs. 150 lakh?
6
5
4
3
Score of how many of the groups can be determined uniquely?
1
2
3
4
Suppose that each widget sells for Rs. 150. What is the profit earned by ABC Ltd. in July? (Profit is defined as the excess of sales revenue over total cost.)
2400
1600
400
0
Which of the salts has greater change in solubility in kg / litre of water between 15°C and 25°C?
Potassium Chlorate
Potassium Nitrate
Sodium Chlorate
Sodium Nitrate
If sales were Rs. 1200 crore in 1990, then what were the total sales in the period 1990-1995?
Rs. 8628 crore
Rs. 9828 crore
Rs. 9156 crore
Rs. 8136 crore
Find the ratio of cars, scooters and motorbikes exported in 1996 :
25 : 16 : 19
16 : 25 : 19
19 : 16 : 25
6 : 5 : 1
In the given personal profile, which is the value with the lowest score?
Theoretical
Religious
Social
Aesthetic
The number of males passing out from colleges A and B together is what percent of the number of females passing out from colleges C and D together?
50
45
40
35
Total production in July is 40 units. What is the approximate average unit cost for July?
3600
90
140
115
In which month did the company earn maximum profits?
5
4
3
2
The growth rate is very marginal during the month of :
August
October
November
December
In which year was the increase in spending on CSR, vis-a-vis the previous year, the maximum?
2006
2007
2008
2009
In which of the following years was the production of motorbikes exactly 40% of the total production of automobiles in that years?
1997
2000
1999
1996
Among the four infants, who grew the least in the first five months of life?
Geeta
Seeta
Ram
Shyam
In which year was the total number of girls enrolled in all the three schools together second highest?
2005
2006
2007
2008
If there were 30 % old men (approx.) in the club in 2013 then what is the percentage of new young men to the young men in the group in 2014, considering there were no old man join the club?
74.52
57.36
39.24
18.07
What is the profit in the year 1998?
Rs. 110
Rs. 143
Rs. 95
cannot be determined
What is the total expenditure during the period under review (7 months) in 1997?
21,07,000
21,96,000
21,54,000
21,24,000
The expenditure in 1997 was ….. less than that of the corresponding period in 1999.
3.27%
2.5%
1.5%
2%
In which month was the greatest absolute change in market value for any share recorded?
March
April
May
June
For which restaurant difference is maximum in revenue earned through Chinese food in Take-away and Dine-in section?
Foodie
Dhaba
Lazeez
Sarson
Compare the three and state which of the given values is the highest in the personal profile of the student?
Theoretical
Religious
Social
Economic
In which value score, there exists convergence between personal profile and average female profile?
Theoretical
Social
Aesthetic
None of the above
With profitability as defined in question 137, it can be concluded that
Profitability is non-decreasing during the five years from 1994-95 to 1998-99.
Profitability is non-increasing during the five years from 1994-95 to 1998-99.
Profitability remained constant during the five years from 1994-95 to 1998-99.
None of the above
If C has achieved the lowest possible score then-
A has 4 possible total score
D has 4 possible total score
B has 2 possible total score
D has 3 possible total score
The performance for which of the following houses is the best?
Pearl
Ruby
Topaz
Sapphire
In which month is the total increase in the cost highest as compared to two months ago?
March
September
July
May
After which month did Seetas rate of growth start to decline?
Second month
Third month
Fourth month
Never
If the forecasted demand is met by having uniform production during the weeks at an average level, then the number of weeks during which demand will not be met is :
2
3
4
None of these