
Direction.
Study the following graph carefully and answer the questions given below it.
% profit Earned by a company over the years Per Cent Profit = (Income Expenditure) / expenditure x 100.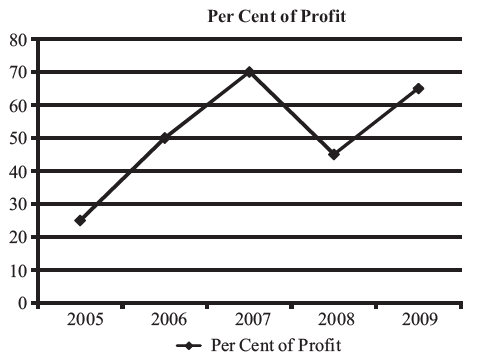
If the income of the company in the year 2005 and the year 2007 was 6,80,000 each, then what was the difference in expenditures of the company in the year 2005 and 2007?
1,24,000
1,40,000
1,50,000
None of these
Correct Answer :
D. None of these
Year 2005
25 = 6,80,000 – E / E × 100 ;
25 E = 6,80,00000 – 100E ;
E = 6,80,00000 / 125 = 5, 44, 000
Year 2006
70 = 6,80,000 – E / E × 100
70 E = 6,80,00000 – 100E
E = 6,80,00000 / 170 = 4,00,000
Difference = 5,44,000 – 4,00,000 = 1,44,000
Related Questions
Assuming that no employees left the job, how many more people did the company take on in the given period?
4,600
5,000
5,800
6,400
For which restaurant difference is maximum in revenue earned through Chinese food in Take-away and Dine-in section?
Foodie
Dhaba
Lazeez
Sarson
In the year 2000, total profit made by the departmental store was approximately :
Rs. 540 lakh
Rs. 630 lakh
Rs. 720 lakh
Rs. 770 lakh
In which month did the company earn maximum profits?
5
4
3
2
Of the years indicated below, in which year was the ratio of CSR Assets the maximum?
2004
2005
2006
2008
What is the average number of students (males and females) passed out from all the colleges together?
38000
48000
42000
None of these
What was the approximate average number of girls enrolled in the year 2006 in all the three schools together?
20,800
23,000
20,000
21,600
Find the ratio of cars, scooters and motorbikes exported in 1996 :
25 : 16 : 19
16 : 25 : 19
19 : 16 : 25
6 : 5 : 1
If the maximum production capacity is 300 units, then the unmet demand will be
225
275
175
All the demand will be met
The circulation in October is . . . times than that of July.
1.5
2
1
1.15
An individual wishes to sell 1 share of C and 1 share of D to buy 1 share of A at the end of a month. At which month-end would the individuals loss from this decision, due to share value changes, be the most?
February
March
April
June
If C has achieved the lowest possible score then-
A has 4 possible total score
D has 4 possible total score
B has 2 possible total score
D has 3 possible total score
In which year is the sales per rupee of expenditure the lowest?
1990
1991
1992
1993
In which month was the greatest percentage increase in market value for any share recorded?
February
March
April
May
What was the maximum value of spending on CSR activities in the period 2004 2009?
Rs. 0.5 Crore
Rs. 1.0 Crore
Rs. 2.0 Crore
Rs. 3.0 Crore
The highest percentage growth in net profit, relative to the previous year, was achieved in
1998-99
1997-98
1996-97
1995-96
In which year was the total number of girls enrolled in all the three schools together second highest?
2005
2006
2007
2008
If A has achieved the highest score then what is the score achieved by C
330
335
325
Cant determine
If the total amount invested by the two companies in 2009 was ` 27 lakh while the amount invested by company B was 50% of the amount invested by Company A, what was the total profit earned by the two companies together?
21.15 lakh
20.70 lakh
18.70 lakh
20.15 lakh
In which month did the company witness maximum sales growth?
9
6
7
1
The expenditure in April 1999 was . . . . . . . . higher than that of corresponding period in 1998.
1.5%
2%
2.5%
0.94%
What is the gross profit in 1993?
Rs. 27
Rs. 30
Rs. 35
None of these
What is the profit in the year 1998?
Rs. 110
Rs. 143
Rs. 95
cannot be determined
In which of the following quarters, did the departmental store make the least amount of profits?
Third quarter of 2000
Second quarter of 1999
First quarter of 1999
Third quarter of 1998
Defining profitability as the ratio of net profit to sales, IVP Ltd. recorded the highest profitability in
1998-99
1997-98
1994-95
1996-97
How many restaurants performed better than Sarson in Take away and better than Dhaba in Dine In?
0
1
2
3
For monthly production level in the range of 0 to 30 units,
AC is always higher than MC.
AC is always lower than MC.
AC is lower than MC up to a certain level and then is higher than MC.
None of the above is true.
An individual decides to sell 1 share of C and 1 share of D to buy 1 share of A at the end of the month. What can be the individuals greatest gain from this decision, due to share value changes?
5
10
15
None
The per cent profit earned by the company in the year 2009 was what percent of the per cent profit earned by the company in the year 2005?
200
240
260
255
In which year, the maximum profit was generated vis-�-vis in?
1991
1992
1993
1994