
Direction.
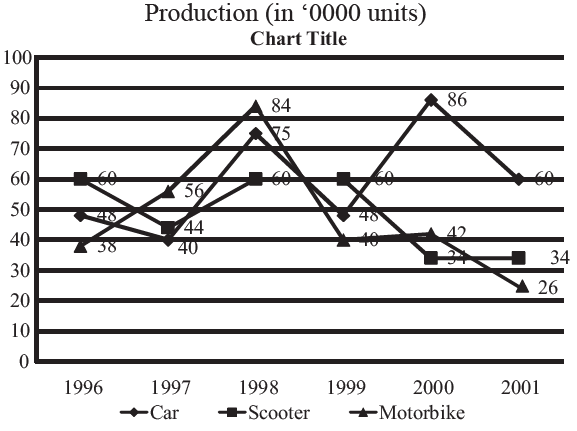
Directions: Study the following line graphs which show the production (in, 0000 units) and percentage expected of scooters, motor bikes and car respectively over the years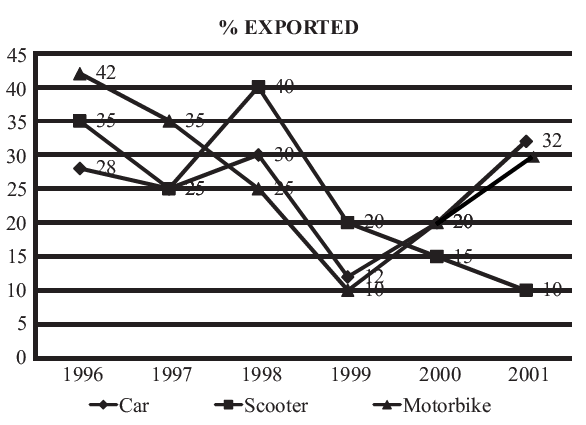
If the ratio of export prices of a cars, scooter and motorbike was 2 : 1 : 1.5 in 1998, what was the proportion of their export earnings?
4 : 2 : 3
6 : 1 : 21
45 : 24 : 31.5
Cannot be determined
Correct Answer :
C. 45 : 24 : 31.5
required ratio = 30% of 75 × 2 : 40% of 60 × 1 : 25 % of 84 × 1.5 = 45 : 24 : 31.5
Related Questions
In which values score, there exists maximum difference between average female profiles and personal profile?
Theoretical
Religious
Economic
Political
Assume that the unit price is Rs. 150 and profit is defined as the excess of sales revenue over total costs. What is the monthly production level of ABC Ltd. at which the profit is highest?
30
50
60
40
Which month has the highest profit per employee?
September
July
January
March
Which of the salts has greater change in solubility in kg / litre of water between 15°C and 25°C?
Potassium Chlorate
Potassium Nitrate
Sodium Chlorate
Sodium Nitrate
Which month records the highest profit?
September
July
March
May
Mr.X, a funds manager with an investment company invested 25% of his funds in each of the four commodities at the beginning of the period. He sold the commodities at the end of the period. His investments in the commodities resulted in:
17% profit
5.5% loss
no profit, no loss
3% profit
In 2004, the prices of plywood, sawn timber and logs went up by 5%, 1% and 10% respectively and the total sales were made up of 40% plywood, 30% sawn timber and 30% logs. The average realization per cubic metre in 2004 was closest to
Rs. 15,500
Rs. 16,135.5
Rs. 14,500
Rs. 18,500
In which year is the sales per rupee of expenditure the lowest?
1990
1991
1992
1993
The highest percentage of growth in sales, relative to the previous year, occurred in
1995-96
1996-97
1997-98
1998-99
For which restaurant the revenue earned from Indian food is maximum
Foodie
Dhaba
Pizza hut
Sarson
If A has achieved the highest score then what is the score achieved by C
330
335
325
Cant determine
If sales were Rs. 1200 crore in 1990, then what were the total sales in the period 1990-1995?
Rs. 8628 crore
Rs. 9828 crore
Rs. 9156 crore
Rs. 8136 crore
The number of females passed out from college C is approximately what percent of the total number of females passed out from all the colleges together?
28
30
36
25
In which month is the total increase in the cost highest as compared to two months ago?
March
September
July
May
What were average sales and costs of figures for XYZ Co. over the period of ten months?
1819, 1651
1919, 1751
1969, 1762
1719, 1601
For which of the following houses is the percentage change in the results maximum for any years over the previous years?
Topaz
Pearl
Sapphire
Ruby
In which year the number of cars sold was the lowest but financial turnover, the maximum?
1993
1994
1995
1996
In which month was the greatest absolute change in market value for any share recorded?
March
April
May
June
The average number of students for each house who have passed in the given years is
61
52
63
56
The number of students keeps on increasing by 50 every years. In 1998, there were 250 students. For which of the following years is the performance best in the school?
1998
2000
1999
Cannot be determined
By what % is the solubility of Potassium Chlorate in water increased as the water is heated from 30°C to 80°C?.
100
200
250
300
If the base of the profit index is changed to 1993 = 100, then what would be the index of profit for the year 2000?
104
100
109
None of these
In the year 2000, total profit made by the departmental store was approximately :
Rs. 540 lakh
Rs. 630 lakh
Rs. 720 lakh
Rs. 770 lakh
The rate of growth during the third month was the lowest for
Geeta
Seeta
Ram
Shyam
If the amount invested by the two companies in 2005 was equal, what was the ratio of the total income of the company A to that of B in 2005?
31 : 33
33 : 31
34 : 31
14 : 11
In which of the following quarters, did the departmental store make the least amount of profits?
Third quarter of 2000
Second quarter of 1999
First quarter of 1999
Third quarter of 1998
If the profit earned by the company in the year 2008 was 90,000, what was the income of the company in that year?
2,90,000
2,00,000
1,50,000
Cannot be determined
ABC Ltd. is considering increasing the production level. What is the approximate marginal cost of increasing production from its July level of 40 units?
110
130
150
160
In which year, were the gross sales proceeds the highest?
1992
1993
1994
1995
In which month did the company witness maximum sales growth?
9
6
7
1