
Direction.
Directions: Study the following line graphs which show the production (in, 0000 units) and percentage expected of scooters, motor bikes and car respectively over the years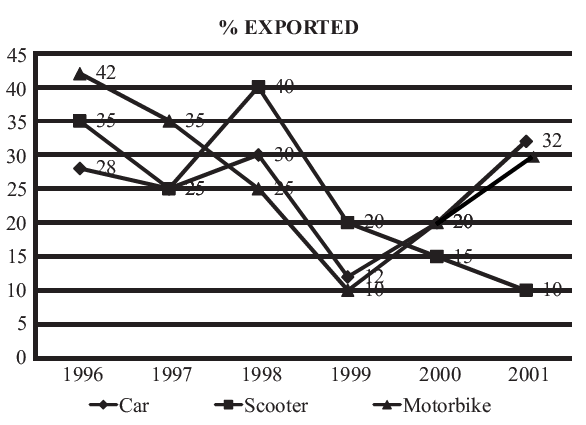
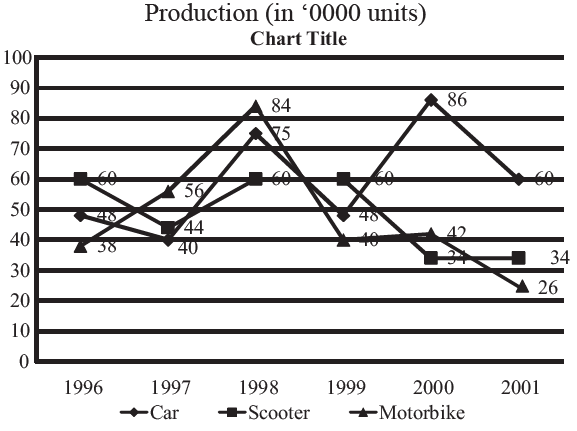
In which of the following years was the production of motorbikes exactly 40% of the total production of automobiles in that years?
1997
2000
1999
1996
Correct Answer :
A. 1997
Related Questions
Find the ratio of cars, scooters and motorbikes exported in 1996 :
25 : 16 : 19
16 : 25 : 19
19 : 16 : 25
6 : 5 : 1
In which year is sales per rupee of equity the highest?
1990
1991
1992
1994
The simple annual growth rate in sales was the highest between the years?
1990 91
1991 92
1992 93
1990 92
Which of the salts has greater change in solubility in kg / litre of water between 15°C and 25°C?
Potassium Chlorate
Potassium Nitrate
Sodium Chlorate
Sodium Nitrate
Which month has the highest profit per employee?
September
July
January
March
ABC Ltd. is considering increasing the production level. What is the approximate marginal cost of increasing production from its July level of 40 units?
110
130
150
160
Which year was the least profitable from the fiscal point of view?
1993
1994
1995
1996
If the base of the profit index is changed to 1993 = 100, then what would be the index of profit for the year 2000?
104
100
109
None of these
In which month was the greatest percentage increase in market value for any share recorded?
February
March
April
May
What is the gross profit in 1993?
Rs. 27
Rs. 30
Rs. 35
None of these
Who grew at the fastest rate in the first two months of life?
Geeta
Seeta
Ram
Shyam
If A has achieved the highest score then what is the score achieved by C
330
335
325
Cant determine
If the amount invested by the two companies in 2005 was equal, what was the ratio of the total income of the company A to that of B in 2005?
31 : 33
33 : 31
34 : 31
14 : 11
If the profit earned by the company in the year 2008 was 90,000, what was the income of the company in that year?
2,90,000
2,00,000
1,50,000
Cannot be determined
Of the years indicated below, in which year was the ratio of CSR Assets the maximum?
2004
2005
2006
2008
What was the maximum value of spending on CSR activities in the period 2004 2009?
Rs. 0.5 Crore
Rs. 1.0 Crore
Rs. 2.0 Crore
Rs. 3.0 Crore
What is the average per cent profit earned by the company over the years?
55
51
62
59
The expenditure in 1997 was ….. less than that of the corresponding period in 1999.
3.27%
2.5%
1.5%
2%
In which month did the company witness maximum sales growth?
9
6
7
1
In which year was the increase in spending on CSR, vis-a-vis the previous year, the maximum?
2006
2007
2008
2009
For monthly production level in the range of 0 to 30 units,
AC is always higher than MC.
AC is always lower than MC.
AC is lower than MC up to a certain level and then is higher than MC.
None of the above is true.
In which value score, there exists convergence between personal profile and average female profile?
Theoretical
Social
Aesthetic
None of the above
The number of educated and illiterate members (not highly educated) who joined the club in 2013 as a percentage of total number of men who joined the club in the same year could not be more than
11.43
15.65
9.63
17.34
In 2004, the prices of plywood, sawn timber and logs went up by 5%, 1% and 10% respectively and the total sales were made up of 40% plywood, 30% sawn timber and 30% logs. The average realization per cubic metre in 2004 was closest to
Rs. 15,500
Rs. 16,135.5
Rs. 14,500
Rs. 18,500
In which school was the difference between the number of girls enrolled in the year 2008 and 2004 minimum?
Only school-A
Only School-B
Both school-A and school-B
Both school-A and school-C
The price volatility of the commodity with the highest PV during the February-July period is approximately equal to:
3%
40%
20%
12%
What was the ratio between the number girls enrolled in the school-C in the year 2007 and the total number of girls enrolled in school-A and school-B together in the same year?
11 : 3
3 : 11
4 : 11
4 : 7
In which of the following years, there was the maximum net growth in car sales as compared to its earlier years?
1994
1992
1993
1995
In which year is the profit per rupee of equity the highest?
1991
1992
1993
1990 1991
Compare the three and state which of the given values is the highest in the personal profile of the student?
Theoretical
Religious
Social
Economic