
Direction.
Directions: These questions are based on the situation given below: The figure below presents sales and net profit, in Rs. Crores, of IVP Ltd for the five years from 1994-95 to 1998-99. During this period, the sales increased from Rs. 100 Crores to Rs. 680 Crores. Correspondingly, the net profit increased from Rs. 2 Crores to Rs. 12 Crores. Net profit is defined as the excess of sales over total costs.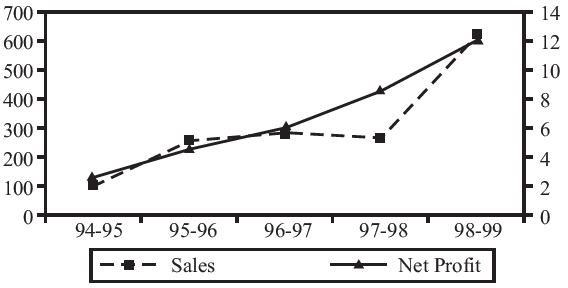
The highest percentage of growth in sales, relative to the previous year, occurred in
1995-96
1996-97
1997-98
1998-99
Correct Answer :
A. 1995-96
We will eliminate options one by one.
(a)
(b) growth in 1996 97 = here we dont need to calculate as graph is almost horizontal so percentage increase must be less than 150%.
(c) growth in 1997 98, again we dont need to calculate as in th is case there is a decrease in the sales.
(d)
Hence it is maximum in the year of 1995 96.
Related Questions
The maximum increase in price per cubic metre for any product between two years was
Rs. 2,500
Rs. 3,000
Rs. 2,000
Rs. 4,125
The performance for which of the following houses is the best?
Pearl
Ruby
Topaz
Sapphire
The expenditure in 1997 was ….. less than that of the corresponding period in 1999.
3.27%
2.5%
1.5%
2%
The highest percentage of growth in sales, relative to the previous year, occurred in
1995-96
1996-97
1997-98
1998-99
What is the average per cent profit earned by the company over the years?
55
51
62
59
The number of educated and illiterate members (not highly educated) who joined the club in 2013 as a percentage of total number of men who joined the club in the same year could not be more than
11.43
15.65
9.63
17.34
What is the average monthly expenditure during the year 1999 covering the period shown in the graph?
2,75,000
2,70,000
3,14,000
2,47,000
In which month did the company witness maximum sales growth?
9
6
7
1
The expenditure in April 1999 was . . . . . . . . higher than that of corresponding period in 1998.
1.5%
2%
2.5%
0.94%
In which month is the total increase in the cost highest as compared to two months ago?
March
September
July
May
In which year is sales per rupee of equity the highest?
1990
1991
1992
1994
If the production is uniform, then what should be the minimum capacity of the storage space to store the units in excess of demand?
25
50
100
200
In which year, the maximum profit was generated vis-�-vis in?
1991
1992
1993
1994
What is the ratio of the total number of males to the total number of females passed out from all the colleges together?
19:23
18:25
23:19
25:18
If the profit was Rs. 600 in 1993, then what was the profit in 1990?
Rs. 441
Rs. 395
Rs. 480
Rs. 545
If 1 mole of Potassium Chloride weighs 0.07456 kg, approximately. How many moles of Potassium Chloride can be dissolved in 100 litres of water at 36°C?
700
650
480
540
If the ratio of export prices of a cars, scooter and motorbike was 2 : 1 : 1.5 in 1998, what was the proportion of their export earnings?
4 : 2 : 3
6 : 1 : 21
45 : 24 : 31.5
Cannot be determined
Which of the salts has greater change in solubility in kg / litre of water between 15°C and 25°C?
Potassium Chlorate
Potassium Nitrate
Sodium Chlorate
Sodium Nitrate
If the profit earned in 2006 by Compnay B was 8,12,500, what was the total income of the company in that year?
12,50,000
20,62,500
16,50,000
None of these
The growth rate is very marginal during the month of :
August
October
November
December
If the base of the profit index is changed to 1993 = 100, then what would be the index of profit for the year 2000?
104
100
109
None of these
Defining profitability as the ratio of net profit to sales, IVP Ltd. recorded the highest profitability in
1998-99
1997-98
1994-95
1996-97
In which year is the sales per rupee of expenditure the lowest?
1990
1991
1992
1993
Which product had the largest percentage increase in price per cubic metre over the 7 year period?
Sawn timber
Logs
Plywood
Cannot be determined
Assume that the unit price is Rs. 150 and profit is defined as the excess of sales revenue over total costs. What is the monthly production level of ABC Ltd. at which the profit is highest?
30
50
60
40
The price volatility of the commodity with the highest PV during the February-July period is approximately equal to:
3%
40%
20%
12%
Among the four infants, who grew the least in the first five months of life?
Geeta
Seeta
Ram
Shyam
If the profit earned by the company in the year 2008 was 90,000, what was the income of the company in that year?
2,90,000
2,00,000
1,50,000
Cannot be determined
The number of females passed out from college C is approximately what percent of the total number of females passed out from all the colleges together?
28
30
36
25
In which year was the total number of girls enrolled in all the three schools together second highest?
2005
2006
2007
2008