
Direction.
Study the data presented in the following graph to answer these questions.
Monthly expenditure of a firm from January to July during the years 1997, 1998, 1999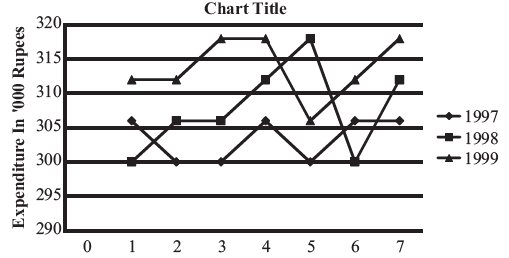
What total expenditure has been made during the year 1997 and 1998 in the period covered in the graph?
42,87,000
2,70,000
48,27,000
42,78,000
Correct Answer :
D. 42,78,000
Related Questions
The per cent profit earned by the company in the year 2009 was what percent of the per cent profit earned by the company in the year 2005?
200
240
260
255
If the trend observed between 1999 and 2000 continues in the next year, what will be number of students passing in the examination in 2001?
245
237
263
300
What is the average number of students (males and females) passed out from all the colleges together?
38000
48000
42000
None of these
Assume that the unit price is Rs. 150 and profit is defined as the excess of sales revenue over total costs. What is the monthly production level of ABC Ltd. at which the profit is highest?
30
50
60
40
An individual decides to sell 1 share of C and 1 share of D to buy 1 share of A at the end of the month. What can be the individuals greatest gain from this decision, due to share value changes?
5
10
15
None
If the train stops at each city for 30% more time that what it is at the moment, then at what time will it reach the city H after departing from city A as per schedule?
Data insufficient
17 : 03
16 : 41
16 : 58
Which group could get maximum percentage increase in the score in any stage when compared to previous stage?
B
A
D
C
In which value score, there exists convergence between personal profile and average female profile?
Theoretical
Social
Aesthetic
None of the above
What is the profit in the year 1998?
Rs. 110
Rs. 143
Rs. 95
cannot be determined
Total production in July is 40 units. What is the approximate average unit cost for July?
3600
90
140
115
If the production is uniform, then what should be the minimum capacity of the storage space to store the units in excess of demand?
25
50
100
200
The number of educated and illiterate members (not highly educated) who joined the club in 2013 as a percentage of total number of men who joined the club in the same year could not be more than
11.43
15.65
9.63
17.34
Approximately, how many kg of Potassium Nitrate can be dissolved in 10 litres of water at 30°C?
0.04
0.4
4
0.35
For which restaurant the revenue earned from Indian food is maximum
Foodie
Dhaba
Pizza hut
Sarson
In 2004, the prices of plywood, sawn timber and logs went up by 5%, 1% and 10% respectively and the total sales were made up of 40% plywood, 30% sawn timber and 30% logs. The average realization per cubic metre in 2004 was closest to
Rs. 15,500
Rs. 16,135.5
Rs. 14,500
Rs. 18,500
Score of how many of the groups can be determined uniquely?
1
2
3
4
In which values score, there exists maximum difference between average female profiles and personal profile?
Theoretical
Religious
Economic
Political
How many restaurants performed better than sarson but not better than Foodie either in Take away or Dine in section?
0
1
2
3
How many restaurants performed better than Sarson in Take away and better than Dhaba in Dine In?
0
1
2
3
What is the difference between the total number of students passing out from college A and the total number of students passing out from college E?
20500
21000
10,000
None of these
Total number of girls enrolled in all the three schools in the year 2004 was what percentage of the number of girls enrolled in school-C in the year 2007?
208
230
200
225
The maximum increase in price per cubic metre for any product between two years was
Rs. 2,500
Rs. 3,000
Rs. 2,000
Rs. 4,125
What was the ratio between the number girls enrolled in the school-C in the year 2007 and the total number of girls enrolled in school-A and school-B together in the same year?
11 : 3
3 : 11
4 : 11
4 : 7
The number of females passed out from college C is approximately what percent of the total number of females passed out from all the colleges together?
28
30
36
25
Which of the following salts has greatest solubility?
Potassium Chlorate at 80°C.
Potassium Chloride at 35°C.
Potassium Nitrate at 39°C.
Sodium Chloride at 85°C.
Assuming that no employees left the job, how many more people did the company take on in the given period?
4,600
5,000
5,800
6,400
If the ratio of export prices of a cars, scooter and motorbike was 2 : 1 : 1.5 in 1998, what was the proportion of their export earnings?
4 : 2 : 3
6 : 1 : 21
45 : 24 : 31.5
Cannot be determined
What was the difference between the average sales index and the average cost index?
7.3
7.7
7.5
7.9
Which month has the highest profit per employee?
September
July
January
March
In which year women and men ratio is greatest?
2011
2012
2013
None of these