Line Graph MCQ Question with Answer
Line Graph MCQ with detailed explanation for interview, entrance and competitive exams. Explanation are given for understanding.
Download Line Graph MCQ Question Answer PDF
Question No : 8
Direction: Study the following graph carefully to answer these questions.
The line graph below shows per cent profit earned by two companies producing electronic goods over the years % Profit = Profit earned / Total Investment x 100 Profit Earned = Total Income Total Investment in the year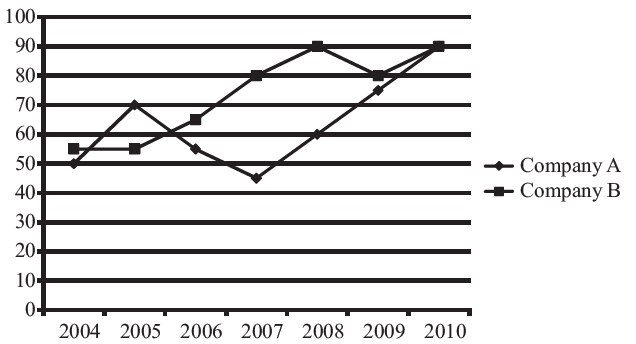
If the total amount invested by the two companies in 2009 was ` 27 lakh while the amount invested by company B was 50% of the amount invested by Company A, what was the total profit earned by the two companies together?
21.15 lakh
20.70 lakh
18.70 lakh
20.15 lakh
Question No : 9
Direction: Study the following graph carefully and answer the questions that follow. Number of Girl students in 000s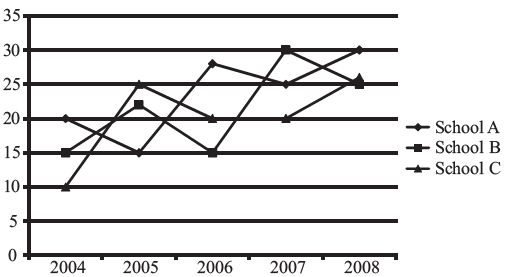
What was the ratio between the number girls enrolled in the school-C in the year 2007 and the total number of girls enrolled in school-A and school-B together in the same year?
11 : 3
3 : 11
4 : 11
4 : 7
Question No : 10
In which school was the difference between the number of girls enrolled in the year 2008 and 2004 minimum?
Only school-A
Only School-B
Both school-A and school-B
Both school-A and school-C
Question No : 11
What was the approximate average number of girls enrolled in the year 2006 in all the three schools together?
20,800
23,000
20,000
21,600
Question No : 12
Total number of girls enrolled in all the three schools in the year 2004 was what percentage of the number of girls enrolled in school-C in the year 2007?
208
230
200
225
Question No : 13
Direction: Study the following graph carefully and answer the questions that follow. Number of Girl students in 000s
In which year was the total number of girls enrolled in all the three schools together second highest?
2005
2006
2007
2008
Question No : 14
Direction: Study the following graph carefully and answer the questions given below it.
% profit Earned by a company over the years Per Cent Profit = (Income Expenditure) / expenditure x 100.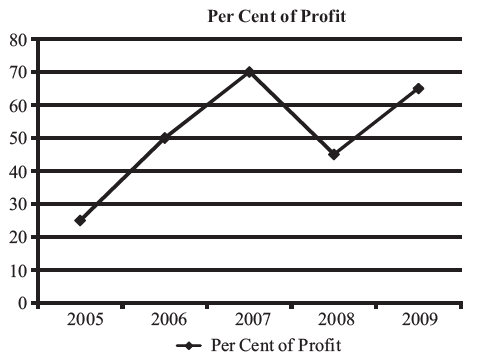
What is the average per cent profit earned by the company over the years?
55
51
62
59