
Direction.
Directions: Study the following line graphs which show the production (in, 0000 units) and percentage expected of scooters, motor bikes and car respectively over the years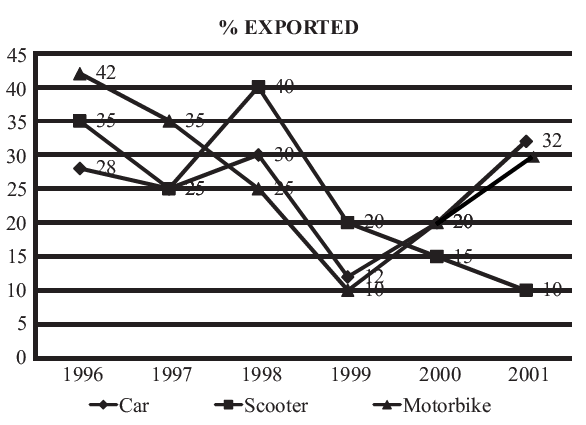
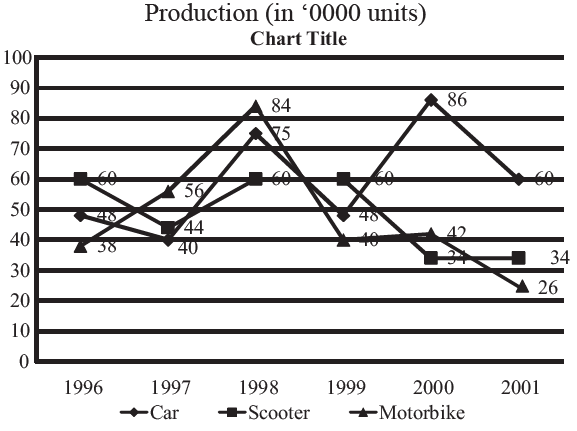
In which of the following years was the production of cars more than 50% of the production?
2000
2001
1998
1996
Correct Answer :
A. 2000
Related Questions
An individual decides to sell 1 share of C and 1 share of D to buy 1 share of A at the end of the month. What can be the individuals greatest gain from this decision, due to share value changes?
5
10
15
None
Score of how many of the groups can be determined uniquely?
1
2
3
4
What is the total expenditure during the period under review (7 months) in 1997?
21,07,000
21,96,000
21,54,000
21,24,000
After which month did Seetas rate of growth start to decline?
Second month
Third month
Fourth month
Never
Which of the following salts has greatest solubility?
Potassium Chlorate at 80°C.
Potassium Chloride at 35°C.
Potassium Nitrate at 39°C.
Sodium Chloride at 85°C.
In which month was the greatest percentage increase in market value for any share recorded?
February
March
April
May
In which year was the increase in spending on CSR, vis-a-vis the previous year, the maximum?
2006
2007
2008
2009
By what % is the solubility of Potassium Chlorate in water increased as the water is heated from 30°C to 80°C?.
100
200
250
300
In which year is the profit per rupee of equity the highest?
1991
1992
1993
1990 1991
How many restaurants performed better than Sarson in Take away and better than Dhaba in Dine In?
0
1
2
3
Compare the three and state which of the given values is the highest in the personal profile of the student?
Theoretical
Religious
Social
Economic
The number of men who joined the club in 2010 was what % of the total number of people who joined the club in the same year?
0.63
0.75
0.27
0.11
If the forecasted demand is met by having uniform production during the weeks at an average level, then the number of weeks during which demand will not be met is :
2
3
4
None of these
In which month is the percentage increase in sales two months before, the highest?
March
September
July
May
In 2004, the prices of plywood, sawn timber and logs went up by 5%, 1% and 10% respectively and the total sales were made up of 40% plywood, 30% sawn timber and 30% logs. The average realization per cubic metre in 2004 was closest to
Rs. 15,500
Rs. 16,135.5
Rs. 14,500
Rs. 18,500
In which year the number of cars sold was the lowest but financial turnover, the maximum?
1993
1994
1995
1996
If the profit was Rs. 600 in 1993, then what was the profit in 1990?
Rs. 441
Rs. 395
Rs. 480
Rs. 545
Suppose that each widget sells for Rs. 150. What is the profit earned by ABC Ltd. in July? (Profit is defined as the excess of sales revenue over total cost.)
2400
1600
400
0
The performance for which of the following houses is the best?
Pearl
Ruby
Topaz
Sapphire
Which month records the highest profit?
September
July
March
May
The rate of growth during the third month was the lowest for
Geeta
Seeta
Ram
Shyam
In which year is the sales per rupee of expenditure the lowest?
1990
1991
1992
1993
The circulation in October is . . . times than that of July.
1.5
2
1
1.15
The average number of students for each house who have passed in the given years is
61
52
63
56
What was the approximate average number of girls enrolled in the year 2006 in all the three schools together?
20,800
23,000
20,000
21,600
If the expenditure of the company in the year 2006 was 75,000, what was the ratio of income to expenditure of the company in that year?
3 : 2
5 : 4
4 : 3
Cannt be determined
What is the average number of students (males and females) passed out from all the colleges together?
38000
48000
42000
None of these
If the profit earned in 2006 by Compnay B was 8,12,500, what was the total income of the company in that year?
12,50,000
20,62,500
16,50,000
None of these
For which of the following houses is the percentage change in the results maximum for any years over the previous years?
Topaz
Pearl
Sapphire
Ruby
ABC Ltd. is considering increasing the production level. What is the approximate marginal cost of increasing production from its July level of 40 units?
110
130
150
160