
Direction.
Study the following graph carefully to answer these questions.
The line graph below shows per cent profit earned by two companies producing electronic goods over the years % Profit = Profit earned / Total Investment x 100 Profit Earned = Total Income Total Investment in the year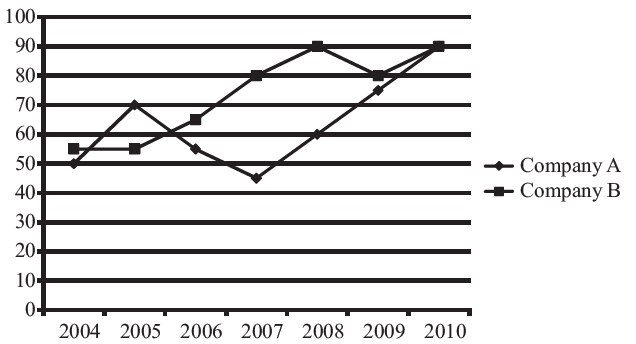
If the profit earned in 2006 by Compnay B was 8,12,500, what was the total income of the company in that year?
12,50,000
20,62,500
16,50,000
None of these
Correct Answer :
B. 20,62,500
Let x be the investment, 55% of x = profit earned (8,12,500).
X = 12,50,000 then income
= profit earned + investment
= 20,62,500 (approx.).
Related Questions
Which year registered the maximum sales turnover?
1994
1995
1992
1993
Find the ratio of cars, scooters and motorbikes exported in 1996 :
25 : 16 : 19
16 : 25 : 19
19 : 16 : 25
6 : 5 : 1
Mr.X, a funds manager with an investment company invested 25% of his funds in each of the four commodities at the beginning of the period. He sold the commodities at the end of the period. His investments in the commodities resulted in:
17% profit
5.5% loss
no profit, no loss
3% profit
Assuming that no employees left the job, how many more people did the company take on in the given period?
4,600
5,000
5,800
6,400
Suppose that each widget sells for Rs. 150. What is the profit earned by ABC Ltd. in July? (Profit is defined as the excess of sales revenue over total cost.)
2400
1600
400
0
What is the average monthly expenditure during the year 1999 covering the period shown in the graph?
2,75,000
2,70,000
3,14,000
2,47,000
In which year the number of cars sold was the lowest but financial turnover, the maximum?
1993
1994
1995
1996
If the income of the company in the year 2005 and the year 2007 was 6,80,000 each, then what was the difference in expenditures of the company in the year 2005 and 2007?
1,24,000
1,40,000
1,50,000
None of these
Find the total number of automobiles exported in the year 1999 :
2,27,600
2,07,600
2,17,600
2,20,000
In which of the following quarters, did the departmental store make the least amount of profits?
Third quarter of 2000
Second quarter of 1999
First quarter of 1999
Third quarter of 1998
What is the difference between the total number of students passing out from college A and the total number of students passing out from college E?
20500
21000
10,000
None of these
The simple annual growth rate in sales was the highest between the years?
1990 91
1991 92
1992 93
1990 92
From the data provided it can be inferred that, for production levels in the range of 0 to 60 units,
MC in an increasing function of producing quantity.
MC is a decreasing function of production quantity.
Initially MC is a decreasing function of production quantity, attains a minimum and then it is an increasing function of production quantity.
None of the above
The number of males passing out from colleges A and B together is what percent of the number of females passing out from colleges C and D together?
50
45
40
35
The highest percentage growth in net profit, relative to the previous year, was achieved in
1998-99
1997-98
1996-97
1995-96
If the profit earned in 2006 by Compnay B was 8,12,500, what was the total income of the company in that year?
12,50,000
20,62,500
16,50,000
None of these
If the total amount invested by the two companies in 2009 was ` 27 lakh while the amount invested by company B was 50% of the amount invested by Company A, what was the total profit earned by the two companies together?
21.15 lakh
20.70 lakh
18.70 lakh
20.15 lakh
What is the average number of students (males and females) passed out from all the colleges together?
38000
48000
42000
None of these
The price volatility of the commodity with the highest PV during the February-July period is approximately equal to:
3%
40%
20%
12%
If A has achieved the highest score then what is the score achieved by C
330
335
325
Cant determine
In the given personal profile, which is the value with the lowest score?
Theoretical
Religious
Social
Aesthetic
In 2004, the prices of plywood, sawn timber and logs went up by 5%, 1% and 10% respectively and the total sales were made up of 40% plywood, 30% sawn timber and 30% logs. The average realization per cubic metre in 2004 was closest to
Rs. 15,500
Rs. 16,135.5
Rs. 14,500
Rs. 18,500
In which of the following years, there was the maximum net growth in car sales as compared to its earlier years?
1994
1992
1993
1995
Which month has the highest profit per employee?
September
July
January
March
In which values score, there exists maximum difference between average female profiles and personal profile?
Theoretical
Religious
Economic
Political
An individual decides to sell 1 share of C and 1 share of D to buy 1 share of A at the end of the month. What can be the individuals greatest gain from this decision, due to share value changes?
5
10
15
None
If the production is uniform, then what should be the minimum capacity of the storage space to store the units in excess of demand?
25
50
100
200
In which month did the company witness maximum sales growth?
9
6
7
1
Which month has been the least expensive during 1999?
June
April
May
July
Which year was the least profitable from the fiscal point of view?
1993
1994
1995
1996