Line Graph MCQ Question with Answer
Line Graph MCQ with detailed explanation for interview, entrance and competitive exams. Explanation are given for understanding.
Download Line Graph MCQ Question Answer PDF
Question No : 22
Direction: Study the data presented in the following graph to answer these questions.
Monthly expenditure of a firm from January to July during the years 1997, 1998, 1999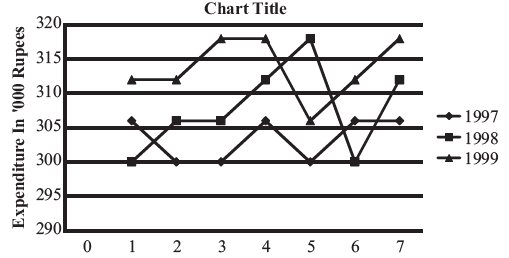
Which month has been the least expensive during 1999?
June
April
May
July
Question No : 23
The expenditure in April 1999 was . . . . . . . . higher than that of corresponding period in 1998.
1.5%
2%
2.5%
0.94%
Question No : 24
The expenditure in 1997 was ….. less than that of the corresponding period in 1999.
3.27%
2.5%
1.5%
2%
Question No : 25
In how many months out of the given 7 months expenditure in 1998 is more than that in 1997 but less than that in 1999.
2
3
4
5
Question No : 26
Direction: Directions: Study the following graph to answer these questions. Index of sales, cost, and profit 120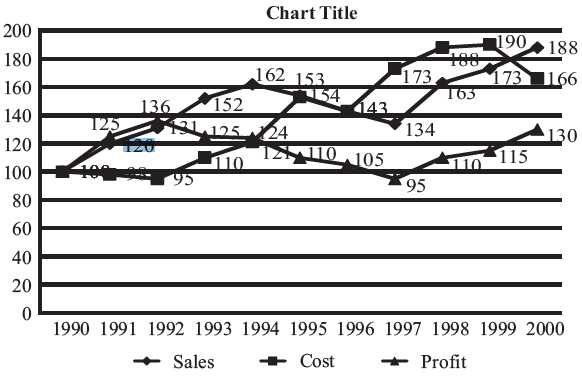
Profit = Sales - Cost - Tax
Gross Profit = Sales - Cost
What is the profit in the year 1998?
Rs. 110
Rs. 143
Rs. 95
cannot be determined
Question No : 27
What is the gross profit in 1993?
Rs. 27
Rs. 30
Rs. 35
None of these
Question No : 28
If the profit was Rs. 600 in 1993, then what was the profit in 1990?
Rs. 441
Rs. 395
Rs. 480
Rs. 545