Line Graph MCQ Question with Answer
Line Graph MCQ with detailed explanation for interview, entrance and competitive exams. Explanation are given for understanding.
Download Line Graph MCQ Question Answer PDF
Question No : 15
Direction: Study the following graph carefully and answer the questions given below it.
% profit Earned by a company over the years Per Cent Profit = (Income Expenditure) / expenditure x 100.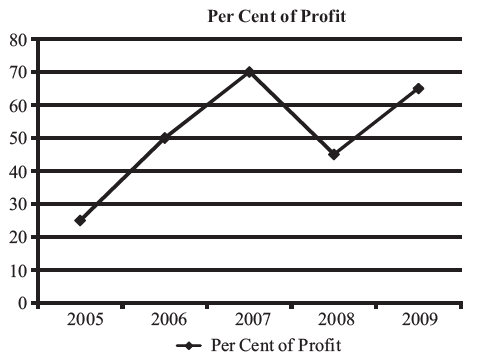
If the expenditure of the company in the year 2006 was 75,000, what was the ratio of income to expenditure of the company in that year?
Question No : 16
The per cent profit earned by the company in the year 2009 was what percent of the per cent profit earned by the company in the year 2005?
Question No : 17
If the income of the company in the year 2005 and the year 2007 was 6,80,000 each, then what was the difference in expenditures of the company in the year 2005 and 2007?
Question No : 18
If the profit earned by the company in the year 2008 was 90,000, what was the income of the company in that year?
Question No : 19
Direction: Study the data presented in the following graph to answer these questions.
Monthly expenditure of a firm from January to July during the years 1997, 1998, 1999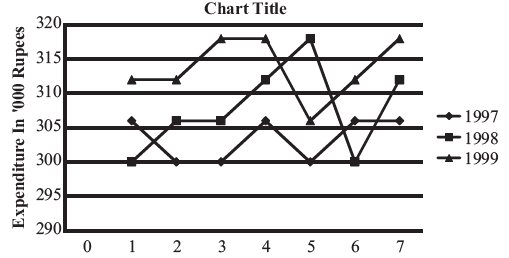
What is the total expenditure during the period under review (7 months) in 1997?
Question No : 20
What total expenditure has been made during the year 1997 and 1998 in the period covered in the graph?
Question No : 21
What is the average monthly expenditure during the year 1999 covering the period shown in the graph?