Line Graph MCQ Question with Answer
Line Graph MCQ with detailed explanation for interview, entrance and competitive exams. Explanation are given for understanding.
Download Line Graph MCQ Question Answer PDF
Question No : 29
Direction: Directions: Study the following graph to answer these questions. Index of sales, cost, and profit 120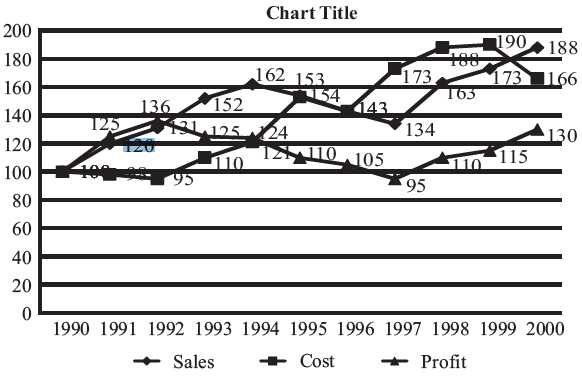
Profit = Sales - Cost - Tax
Gross Profit = Sales - Cost
If the base of the profit index is changed to 1993 = 100, then what would be the index of profit for the year 2000?
104
100
109
None of these
Question No : 30
If sales were Rs. 1200 crore in 1990, then what were the total sales in the period 1990-1995?
Rs. 8628 crore
Rs. 9828 crore
Rs. 9156 crore
Rs. 8136 crore
Question No : 31
What was the difference between the average sales index and the average cost index?
7.3
7.7
7.5
7.9
Question No : 32
Direction: Directions: Study the graph given below to answer these questions.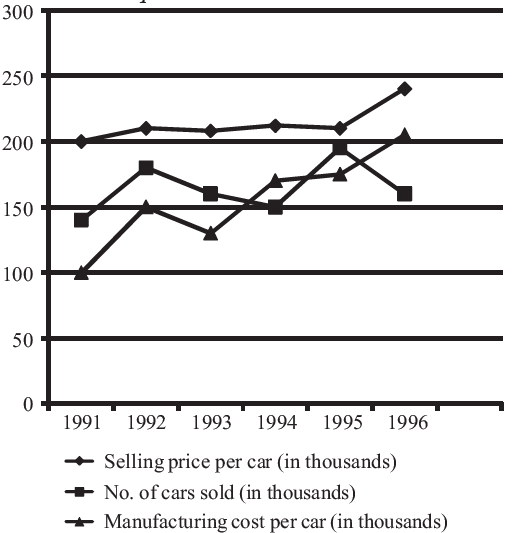
In which year, were the gross sales proceeds the highest?
1992
1993
1994
1995
Question No : 33
Which year was the least profitable from the fiscal point of view?
1993
1994
1995
1996
Question No : 34
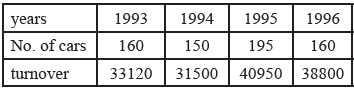
In which year the number of cars sold was the lowest but financial turnover, the maximum?
1993
1994
1995
1996
Question No : 35
In which year, the maximum profit was generated vis-�-vis in?
1991
1992
1993
1994