Line Graph MCQ Question with Answer
Line Graph MCQ with detailed explanation for interview, entrance and competitive exams. Explanation are given for understanding.
Download Line Graph MCQ Question Answer PDF
Question No : 43
Direction: Directions: Study the following graph, showing the sales forecast for the next ten weeks, to answer these questions.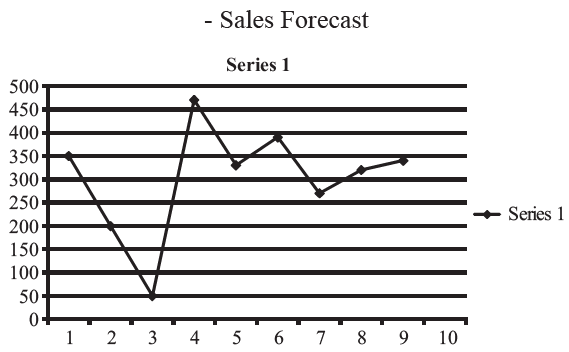
If the forecasted demand is met by having uniform production during the weeks at an average level, then the number of weeks during which demand will not be met is :
2
3
4
None of these
Question No : 44
If the production is uniform, then what should be the minimum capacity of the storage space to store the units in excess of demand?
25
50
100
200
Question No : 45
If the maximum production capacity is 300 units, then the unmet demand will be
225
275
175
All the demand will be met
Question No : 46
Direction: Directions: Use the graph given below to answer these questions : Given is graph is the profile of values of a college student marked as personal profile. The normative profiles are given as average male profile and average female profile.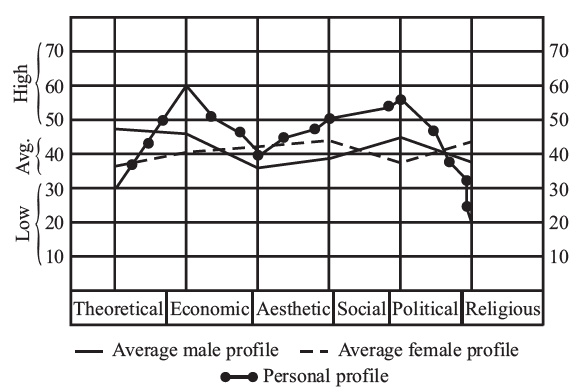
Compare the three and state which of the given values is the highest in the personal profile of the student?
Theoretical
Religious
Social
Economic
Question No : 47
In the given personal profile, which is the value with the lowest score?
Theoretical
Religious
Social
Aesthetic
Question No : 48
In which values score, there exists maximum difference between average female profiles and personal profile?
Theoretical
Religious
Economic
Political
Question No : 49
In which value score, there exists convergence between personal profile and average female profile?
Theoretical
Social
Aesthetic
None of the above