
Direction.
Directions: The scatter diagram shows the number of students passing in the high school examination in the given years from the four houses of a public school.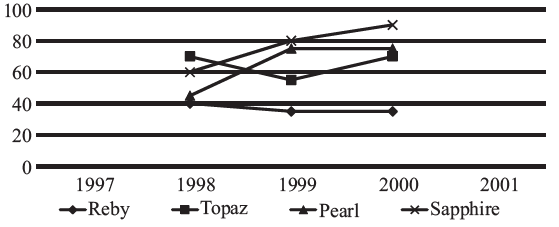
If the trend observed between 1999 and 2000 continues in the next year, what will be number of students passing in the examination in 2001?
245
237
263
300
Correct Answer :
D. 300
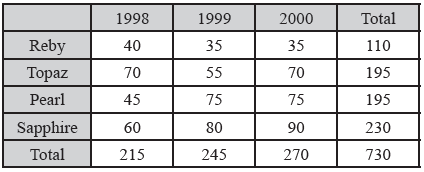
as if we follow the trend the total number of students passed in 1999 was 245 and 2000 were 270, so the no. of students passed in 2001 would be around 300.
Related Questions
During the period 1998-2000, how many quarters exceeded the profit of Rs. 150 lakh?
6
5
4
3
Of the years indicated below, in which year was the ratio of CSR Assets the maximum?
2004
2005
2006
2008
The rate of growth during the third month was the lowest for
Geeta
Seeta
Ram
Shyam
The performance for which of the following houses is the best?
Pearl
Ruby
Topaz
Sapphire
Which product had the largest percentage increase in price per cubic metre over the 7 year period?
Sawn timber
Logs
Plywood
Cannot be determined
Approximately, what was the actual profit made by the department store in the second quarter of 1999?
Rs. 160 lakh
Rs. 170 lakh
Rs. 180 lakh
Rs. 210 lakh
In which year is the profit per rupee of equity the highest?
1991
1992
1993
1990 1991
In which month is the total increase in the cost highest as compared to two months ago?
March
September
July
May
After which month did Seetas rate of growth start to decline?
Second month
Third month
Fourth month
Never
If the train stops at each city for 30% more time that what it is at the moment, then at what time will it reach the city H after departing from city A as per schedule?
Data insufficient
17 : 03
16 : 41
16 : 58
In which school was the difference between the number of girls enrolled in the year 2008 and 2004 minimum?
Only school-A
Only School-B
Both school-A and school-B
Both school-A and school-C
In which month was the greatest absolute change in market value for any share recorded?
March
April
May
June
In which values score, there exists maximum difference between average female profiles and personal profile?
Theoretical
Religious
Economic
Political
If sales were Rs. 1200 crore in 1990, then what were the total sales in the period 1990-1995?
Rs. 8628 crore
Rs. 9828 crore
Rs. 9156 crore
Rs. 8136 crore
If the profit earned in 2006 by Compnay B was 8,12,500, what was the total income of the company in that year?
12,50,000
20,62,500
16,50,000
None of these
Find the total number of automobiles exported in the year 1999 :
2,27,600
2,07,600
2,17,600
2,20,000
How many restaurants performed better than sarson but not better than Foodie either in Take away or Dine in section?
0
1
2
3
How many of the restaurant definitely performed better than Dhaba in both Take away and Dine In?
0
1
2
3
The highest percentage of growth in sales, relative to the previous year, occurred in
1995-96
1996-97
1997-98
1998-99
In the year 2000, total profit made by the departmental store was approximately :
Rs. 540 lakh
Rs. 630 lakh
Rs. 720 lakh
Rs. 770 lakh
If the total amount invested by the two companies in 2009 was ` 27 lakh while the amount invested by company B was 50% of the amount invested by Company A, what was the total profit earned by the two companies together?
21.15 lakh
20.70 lakh
18.70 lakh
20.15 lakh
If the expenditure of the company in the year 2006 was 75,000, what was the ratio of income to expenditure of the company in that year?
3 : 2
5 : 4
4 : 3
Cannt be determined
The growth rate is very marginal during the month of :
August
October
November
December
For which restaurant the revenue earned from Indian food is maximum
Foodie
Dhaba
Pizza hut
Sarson
Maximum score of which team is the highest?
B
A
D
C
In the given personal profile, which is the value with the lowest score?
Theoretical
Religious
Social
Aesthetic
What is the profit in the year 1998?
Rs. 110
Rs. 143
Rs. 95
cannot be determined
If the forecasted demand is met by having uniform production during the weeks at an average level, then the number of weeks during which demand will not be met is :
2
3
4
None of these
The price volatility of the commodity with the highest PV during the February-July period is approximately equal to:
3%
40%
20%
12%
In which month did the company witness maximum sales growth?
9
6
7
1